
































































































































Laptop displaying traffic charts and analytics for operational monitoring
/Diagnosing Machine Learning Drift Before Retraining
Machine Learning

Diagnosing Machine Learning Drift Before Retraining

Read time 10 mins
October 9, 2026

Got a question?

Send us your questions, we have the answers

Talk with us

Get expert advice to solve your biggest challenges

Book a Call

The Dashboard Is Green but the Predictions Changed

Imagine a retail recommendation service on an ordinary Monday. Requests arrive on time, the endpoint responds quickly, and the infrastructure dashboard stays green. Yet shoppers see unfamiliar suggestions. This is a hypothetical operating scenario, not a reported incident, and it exposes a gap that ordinary uptime monitoring cannot explain. The first reaction is tempting. Retrain the model, deploy fresh weights, and hope the suggestions improve.

But a changed prediction does not identify its cause. A missing product attribute, a new visitor population, or a delayed catalog refresh can produce symptoms that look like model deterioration. This article approaches the problem from diagnosis rather than lifecycle economics. The immediate question is not how much another training run costs. It is what changed, how the team knows, and which response addresses the actual failure without introducing a second one.

Software development workspace with a laptop displaying source code

A useful monitoring system separates three questions. Did the service execute correctly? Did the model receive the data it expected? Did its predictions remain useful once outcomes became observable? A healthy answer to the first question cannot substitute for evidence about the other two. That distinction matters for leaders as much as engineers.

A dashboard can report activity without establishing quality. Asking whether a model is healthy should lead to a specific baseline, a named evaluation window, and an explanation of what evidence is still missing. Begin with one important model and the decisions it supports. Describe an acceptable outcome in product language, then identify which technical signals would help explain a failure.

This exercise turns an abstract promise of observability into a practical agreement about what the team must investigate. The goal is not a wall of charts or a permanent stream of warnings. It is a repeatable path from an unexpected signal to a defensible decision. That path starts before anyone presses the retraining button.

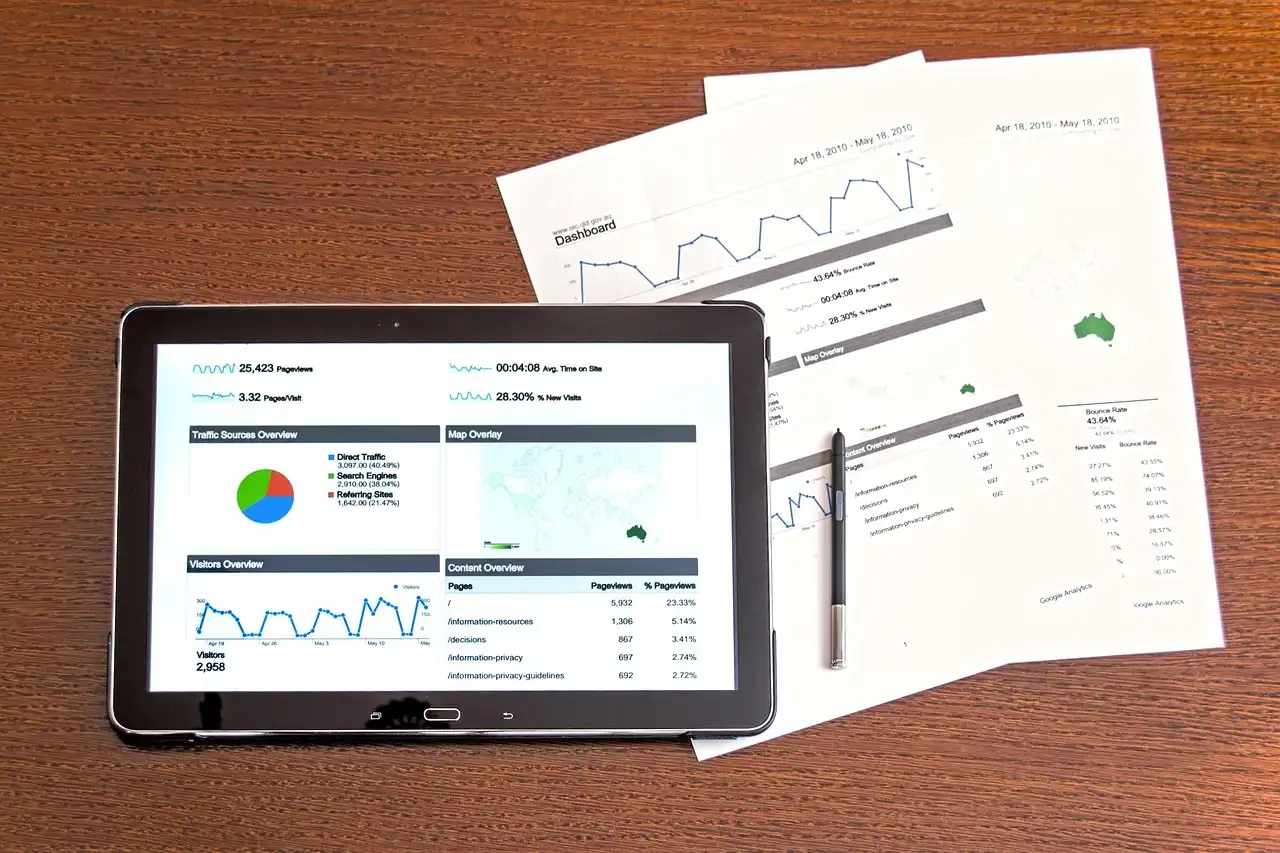
Analytics charts on a tablet beside printed reports

Three Signals for Production Model Health

Operational monitoring measures, not industry benchmark statistics.

01

Data integrity, including missing values, unexpected categories, and delayed feature updates

02

Distribution changes against a documented training or production baseline

03

Prediction quality against mature outcome labels across relevant customer and product segments

Give Every Alert a Baseline and a Comparison Window

An alert that says the data changed leaves an important question unanswered. Changed compared with what? The training dataset, yesterday's requests, and a normal seasonal period are different reference points. A monitor needs an explicit baseline before its result can guide an investigation. Google's model-monitoring documentation distinguishes training-serving skew from inference drift. The first compares production feature distributions with training data. The second compares production inputs across time.

Both describe distribution differences, not a complete explanation of whether a particular business decision became worse. Suppose the hypothetical retailer launches a campaign aimed at first-time visitors. The incoming audience can shift even when the ingestion pipeline works correctly. A monitor should flag that difference, but the team still needs evidence about recommendation quality before deciding that the model itself requires repair.

Choose comparison windows that fit the decision cycle. An hourly view may reveal a broken feed; a longer view may help separate recurring patterns from persistent changes. Document the choice rather than accepting whichever interval happens to be easiest to display. Keep volume beside every distribution chart. A small group can move sharply because very few observations arrived.

The operational response should reflect both the size of the change and the amount of evidence supporting it, especially when an alert concerns an uncommon customer or product segment. Avoid applying one unexplained threshold to every feature. Missing inventory status and a modest shift in browsing categories have different implications. Set initial thresholds using historical behavior and decision risk, then record why each important threshold exists and who can change it.

A practical alert should carry its own context: the feature involved, the baseline version, the observation window, the sample size, and the affected segment. Without that information, the engineer receiving the notification must reconstruct the monitor before investigating the model. Treat distribution monitoring as an early-warning instrument. Its job is to make changed conditions visible and route a focused investigation. It should not silently convert every warning into an automatic instruction to rebuild the model.

Server hardware supporting production data infrastructure
Source code on a monitor for inspecting application behavior

Evaluating Retraining Thresholds Without Blind Guesswork

Most engineering teams trigger retraining schedules based on arbitrary calendar cycles instead of actual value degradation. By calculating the exact financial tipping point where prediction error costs exceed compute expenses, you replace guesswork with a predictable economic trigger.

Explore Machine Learning

Repair the Data Contract Before You Blame the Model

Before debating model architecture, inspect the path that produces each feature. A renamed category, a unit conversion, or an unexpected default value can change predictions without changing the model artifact. Retraining on that damaged input may obscure the fault rather than remove it. TensorFlow Data Validation describes checks against a data schema as well as comparisons between datasets. These are different checks with different purposes.

A value can satisfy its expected format while its distribution changes, and a distribution report does not replace validation of required fields. In the retail example, imagine that an upstream service starts expressing a product's weight in a different unit. The resulting values might remain numeric and therefore pass a simple type check. A meaningful data contract needs the business interpretation of that field, not merely its storage type.

Write the contract at the boundary where the model receives data. Identify required features, allowed categories, missing-value behavior, expected units, and freshness requirements. Record which transformations happen upstream and which happen inside the serving process so ownership does not disappear between teams. Then compare how the same example is represented during training and during inference. Google's Rules of Machine Learning emphasizes avoiding training-serving skew.

For an operating team, that means testing the feature path as a system rather than assuming separately correct components produce an equivalent representation. A useful diagnostic packet pairs the alert with recent pipeline changes. Include schema revisions, transformation versions, catalog updates, and source-feed delays. These details help distinguish an ingestion incident from an intentional product change before the team reaches for a new training dataset. Do not blindly refresh a baseline after discovering an anomaly.

That can make the warning disappear while preserving the broken behavior. Establish whether the new data is valid, document the explanation, and only then decide whether the reference distribution should change. When the contract is broken, fix the contract first. When the contract holds but the population has changed, continue the investigation. Clear boundaries prevent an ambiguous data problem from becoming an expensive and poorly understood model release.

When you treat model maintenance as an afterthought, every retraining run becomes an emergency fire drill rather than a predictable engineering cadence.

Measure Outcomes Across the People Your Model Serves

Input monitoring answers whether the model's environment looks different. Outcome evaluation asks whether the predictions still work. The two complement each other, but they are not interchangeable. A changed feature distribution can be harmless, while disappointing outcomes can emerge without a dramatic input alert. Start by connecting predictions to the outcomes needed for evaluation. A recommendation impression, a later purchase, and a returned item occur at different times.

Your evaluation window should state which outcomes are sufficiently mature to compare and which are still incomplete. Otherwise, a recent cohort can look worse simply because its labels have not arrived. A team might mistake an unfinished measurement period for deteriorating quality. Display label coverage and observation age alongside the performance measure, rather than hiding those limitations in a separate analytics workflow.

TensorFlow Model Analysis supports evaluation over feature slices and tracking metrics over time. That provides a useful foundation for asking where performance differs. An overall average can conceal a problem affecting a smaller group, even when the aggregate metric appears stable. For the hypothetical retailer, examine relevant slices such as new versus returning visitors, product availability, or device experience. These are investigation choices, not universal requirements.

Select slices that reflect real product behavior and collect enough evidence before drawing conclusions from a small subgroup. Keep the metric tied to the decision being assessed. A ranking score, a classification error, and a completed customer action describe different things. Improvement in one technical metric does not automatically establish that the customer's experience improved or that the product generated additional value. Compare candidate models on matched, appropriately labeled examples before deployment.

Shadow traffic can reveal serving incompatibilities and prediction differences without changing user decisions. It does not, by itself, establish the causal business effect of replacing the live model with the candidate. Present uncertainty plainly. When feedback is incomplete, say the monitor has detected a condition that warrants attention, not that it has proved failure. Leaders make better operating decisions when evidence and inference remain visibly separate.

Turn Monitoring Signals Into a Safe Response Playbook

A monitor becomes operationally useful when the team knows what to do next. Define response paths before the first serious incident. The path for a missing feature should not be identical to the path for a valid population change or a confirmed deterioration in prediction quality. For a data-integrity failure, investigate ingestion and transformations.

Depending on the model's role, the appropriate containment might be a validated default, a simpler fallback, or a pause in automated decisions. The response should protect the product while preserving the evidence needed to understand the failure. For distribution change without confirmed performance loss, investigate the affected cohort and continue collecting outcomes.

Do not label the model healthy merely because feedback is delayed. Equally, do not promote a replacement simply because a drift threshold was exceeded. The uncertainty belongs in the incident record. For demonstrated performance loss, identify whether a new training dataset represents the conditions the model now encounters. A candidate should pass data checks and evaluation gates before it reaches production.

Retraining is one possible response, not a guarantee that the underlying problem has been solved. Use release controls appropriate to the consequence of a mistake. A limited rollout can expose operating problems that offline evaluation missed. Define the conditions for stopping that rollout and the behavior of the fallback before increasing the candidate's share of live decisions. Keep rollback realistic.

Restoring an earlier model artifact will not repair a broken upstream feed, and the earlier model may also struggle under genuinely new conditions. Test the fallback against the relevant failure scenario instead of treating its existence as proof of resilience. Assign ownership to the full response, not just to individual charts. Someone must connect the data evidence, model evaluation, and product impact into one explanation.

Otherwise, an alert can bounce between teams while each correctly reports that its own component is functioning. A useful runbook ends with a recorded decision and a follow-up check. Capture what changed, why the team selected a response, and how it will verify recovery. Closing the alert should mean the investigation reached a defensible stopping point, not merely that a notification was dismissed.

Printed circuit board with electronic data pathways
Engineer examining electronic equipment in a laboratory

Transforming AI Operations from Cost Center to Asset

When you audit every retraining cycle as a capital investment rather than an IT overhead, your infrastructure stops bleeding cash on idle compute. Intelligent lifecycle governance turns fragile predictive models into dependable revenue drivers that compound in value over time.

Talk with our advisory team

Build an Evidence Trail the Next Team Can Trust

Monitoring quality depends on what survives after an incident ends. Store the model version, feature pipeline version, baseline identifier, evaluation window, and relevant release events together. The next engineer should not need to reverse-engineer a collection of screenshots to reconstruct what the system observed. Retain representative evidence responsibly. Diagnostic records should support investigation without collecting unnecessary customer information.

Choose access controls and retention periods that fit the organization's existing data policies. A monitoring project should not quietly become a second, poorly governed customer database. Review repeated alerts as a design problem. If the same signal produces noise every week, determine whether the baseline, comparison window, or response threshold needs adjustment.

Record the reason for each adjustment so reducing noise does not become an undocumented relaxation of quality expectations. Begin with a narrow implementation. Select an important model, identify its data boundaries, and define one meaningful outcome evaluation. Connect those signals to a response playbook, then run a hypothetical failure exercise before expanding monitoring across the portfolio.

That exercise should test the whole chain: can the team notice the condition, understand the evidence, choose a safe response, and verify recovery? A collection of technically correct monitors can still fail this operating test when ownership or fallback behavior remains unclear. Expand only when the first implementation produces useful decisions. The objective is not to maximize the number of alarms.

It is to make uncertainty visible early enough that teams can act deliberately, without confusing changed traffic, broken data, and genuine model deterioration. Reliable production machine learning begins with that distinction. Before asking whether to retrain, ask what the evidence actually establishes. The team that can answer clearly has a stronger foundation for every model change that follows.

Related Insights

robot holding hologram of data

Machine Learning

Developing Explainable AI Models For Better Understanding

The integration of artificial intelligence (AI) has become increasingly prevalent across various industries, driving transformative changes in how businesses operate and interact with their customers. AI technologies offer a wide range of benefits, from streamlining processes and enhancing productivity to enabling data-driven decision-making and delivering personalized experiences. However, amid the rapid adoption of AI, concerns have arisen regarding the opacity and complexity of AI models, leading to questions about their trustworthiness, fairness, and ethical implications.


desk

How Can Marketeq Help?

InnovateTransformSucceed

Unleashing Possibilities through Expert Technology Solutions

Get the ball rolling

Click the link below to book a call with one of our experts.

Book a call
triangles

Keep Up with Marketeq

Stay up to date on the latest industry trends.